Can you estimate 20-year index returns?
Warren Buffett thinks so. (Fortune) He argues long bond rates correlate inversely to long-term index returns.
Yale economist Robert Schiller, author of Irrational Exuberance and early predictor of the Web and real estate bubbles, also thinks so. He argues PE ratio correlates to long-term index returns.
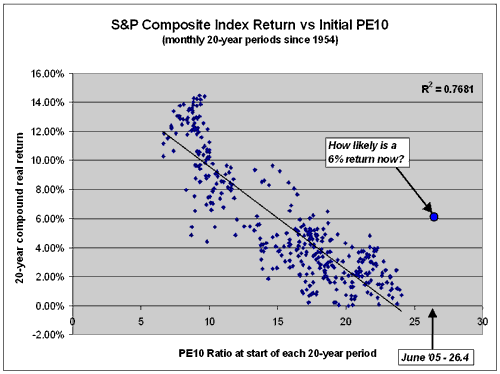
To illustrate this for yourself, get Schiller’s index price/earnings data since 1871, freely available from the Yale economics department (download here), and simply graph PE versus forward 20-year returns.
Depending on your assumptions, you will see a result something like this.

All data is inflation-adjusted.
Each point on this graph shows the PE10 ratio (index price divided by average earnings & dividends over the past 10 years) compared to the 20-year rate of return that immediately followed.
The implication is that high current PE10 implies low 20-year returns. Currently (2005), the PE10 is about 26, implying a 20-year expected inflation-adjusted return of about negative 2%.
Looking at this graph, how likely would you say we are to see 6% real returns in the next 20 years? Or even 3%?
UPDATED 10/22/2008: the recent decline in equities appears to have reduced index P/E to as low as 13. It’s a moving target because earnings are falling fast. However, it appears we are at or near the first major buying opportunity since at least the mid-1990s.
